
A Guide on How to Maximise Technical Performance within a Shopify Theme
Introduction
As a brand operating in an eCommerce landscape which is more competitive than ever before, site speed is an essential consideration for a number of important reasons - from optimising conversion rates, to creating a seamless premium experience that fosters trust to your customers. And, more recently, with Google’s (ever updating) CWV ranking factors, managing technical performance is continuing to play a more critical role.
Alongside plenty of other big topics over the years, site speed is something that we've had countless discussions on with Shopify brands, tech vendors and developers. Unlike other technical aspects that have seen improvements with Shopify updates (such as SEO or product data architecture), slow page load times continue to be a daily challenge for the majority.
There are lots of reasons behind this, but the overarching cause comes down to two points:
- Having a site with a 100 Lighthouse score isn’t a black and white problem to solve, or target to aim for. While Shopify has and continues to push server side updates that gradually introduce improvements, everything else is a balancing act and set of compromises, and the more functionality you require on-site, the lower that score is realistically going to be.
- Shopify's success is built on a thriving app ecosystem and a low barrier to entry (especially relative to competitor platforms) for theme development. However, these two points inherently bring with them the potential of severely impacting the performance of a site when it comes to speed.
With the release of Shopify 2.0, there came a lot of noise about the improvement in performance, and particularly around the speed and metrics being logged of the native Dawn theme. While this was true and pretty positive, it was off the back of measuring a skeleton theme. After factoring back in any custom theme code, apps, image and video assets etc. to create a production ready store, the end result is much the same as ever.
Shopify have recently released an article and some data of their own around publicly available Shopify Themes and the improvement in site speeds across them. However, these are based on skeleton Themes, and may not fully take into account the essentials mentioned above. These elements are crucial for a production store, and can significantly influence load speeds.
Headless (with or without utilising Shopify’s Hydrogen) is commonly discussed at this stage as an alternative to prioritise site speed. Whilst we won’t cover this in too much detail in this article, we are a Headless advocate in the right circumstances, but not purely in the belief of faster load times. Whilst it does open up the potential for that to happen, it is by no means a guarantee. The good news is that it’s absolutely realistic to achieve and expect a fast site, and a site that passes the range of Google CWVs, via a native Shopify Liquid theme build. This article hopefully serves as a valuable reference point for achieving these goals through thoughtful consideration and strategic compromise.
Tools, metrics & methodology
Before looking at how to execute this, it's important to understand what success looks like, and how best to measure it. However, there are a few problems that we find on the topic of page speed and making actionable progress:
- Numerous metrics can be reported on, and multiple tools are available to track and report on them. These metrics aren’t all completely independent, as some stats are incorporated into others, so it’s important not to get blinded by the amount of numbers.
- Different tools may produce conflicting results or interpret them differently. Factors such as measurement methods, server locations, and the time of day can contribute to disparities.
- Requires patience! The allure of transforming numerous red numbers into green can lead to a scattergun approach - rescanning the site morning and afternoon each day to check. Google's Lighthouse scores can vary even within short time frames, and doing the above can easily confuse things more, alongside wasting time and development effort. It can take 14-28 days to see updates impact the indexed pages of your site, and therefore impact genuine user performance data.
Given these points, it’s really important to agree on what success is going to look like in advance and plan the strategy to get there.
Metrics & methodology
We’ve asked a few people who we consider to be the voices of authority on the topic to give their input on where to direct your attention and energy on, and how.
“In the end, Google did the research for us already when it comes to what is important towards real UX, and each metric is different as well. So the term "PageSpeed Insights" doesn't cut it anymore, as First Input Delay (FID), Interaction to Next Paint (INP) and Cumulative Layout Shift (CLS) aren't about pagespeed, but are actually signals towards (possible) user engagement and user frustration.
Sure, Time to First Byte (TTFB) is important as well. But that metric is even more technical (especially as it isn't just the server response time), and largely incorporated in LCP anyway. TTFB then is one of the ways to improve your Largest Contentful Paint (LCP), just like not lazy loading your hero or main product image, for example.”
Erwin Hofman - Pagespeed Consultant
—
“For metrics, we recommend measuring Largest Contentful Paint (LCP) as the ‘site speed’ metric
- Other important metrics are the two other Core Web Vitals: Cumulative Layout Shift (CLS) and Interaction to Next Paint (INP)
- There's also First Input Delay (FID) but Google will be replacing it with INP in March 2024
We recommend taking a scientific approach to measuring and improving site speed, written here. The gist of it is following these steps:
- Measure your current site speed for a specific page (e.g. LCP)
- Hypothesise what changes can improve site speed
- Make a few of those changes in a separate theme
- Measure again to see if site speed has improved
- Repeat!
Also, we recommend focusing on browsing pages first: product pages, collection pages
- The browsing pages are the most vulnerable pages where you lose customers
- The cart and checkout are the least important, since buyers are invested in a purchase at that point”
James Koshigoe - Render Better
—
“The metrics we typically look at are Page Load, Last Byte Time, Last Contentful Paint (LCP), Cumulative Layout Shift (CLS) and Interaction to Next Paint (INP). These give you coverage across all the key parts of the page loading sequence.
In terms of maximising them, it starts with the various page elements, like how fast is the page being built on the server, how many images are loaded and are they lazy loaded, how many 3rd parties or apps are being integrated, can they be controlled to all the product or content to be loaded first, what elements are impacting LCP and CLS and then focus on a specific page to start with to move the needle.”
Martina England - Yottaa
A couple of takeaways from the above should be:
- There are a lot of potential metrics to be looking at and monitoring, but Google has done a good job in selecting metrics within their CWVs that cover the broad range of site experience, so focus on those as the P1 to improve on.
- There are nuances on what other metrics people put their focus on most, alongside reasons to track one metric over another. However, the important bit is to monitor both with structure and consistency.
Tools:
1) Google Search Console
Given the consensus above that Google Core Web Vitals are the best stats to keep a focus on when monitoring site speed, it’s only logical that Search Console is the go-to place for a broad look on how you’re indexing on these metrics. It’s ideal, as this is the exact definition of how Google views your store across these metrics. Maintaining good ranking across all pages is the key here (or start with having no bad scores). However, it is important to note this falls into the earlier bracket of results being visible 14-28 days after changes, rather than instant.
2) Pagespeed Insights, GTMetrix and Webpagetest
While there's a slight variance in some of the additional metrics measured between these options, they essentially perform the same task - providing a quick scan for an immediate overview of the status on the given URL. It’s likely that everyone has used at least one of these to track how pagespeed is looking. A key point here is that one of these is enough to do the job - testing across them all, and mixing and matching results isn’t constructive. Testing and reporting consistently is the best route of genuinely improving continuously.
When considering these tools, it's essential to note that they may not take into account how pages visually load and, consequently, how users perceive performance (although Webpagetest has some nice additional features including this in a paid subscription). Furthermore, since they are "Lab Tests", they provide statistics based on responses from servers configured in specific ways and from particular locations, lacking a true reflection of your genuine users' experiences.
3) Speedcurve and RUMvision
The difference between these tools, and the above, are that they’re specifically built around Real User Monitoring. Despite requiring paid subscriptions (or other similar options), to have continued success and make site speed fundamental to your internal reporting and processes, they can be a great investment. These tools provide a consistent view on how site speed affects your users on a daily, weekly, and monthly basis, offering real-time insights into issues that might otherwise take weeks to identify.
Another point that is under-utilised applies to established brands with a significant international focus. With a big customer base in markets like India, Middle East and certain parts of Europe, there is a likelihood that there could be a broader range of common devices across users, and potentially variable internet connections. These tools can give insight on how different markets are experiencing the site, and influence decisions on localising the content and theme functionality differently for certain markets.
After getting the fundamentals into a good place, and getting Google indexing the site as passing all of the CWVs, user monitoring should become a main focus of the strategy.
4) Shopify Theme Inspector: Shopify liquid flame graph checker
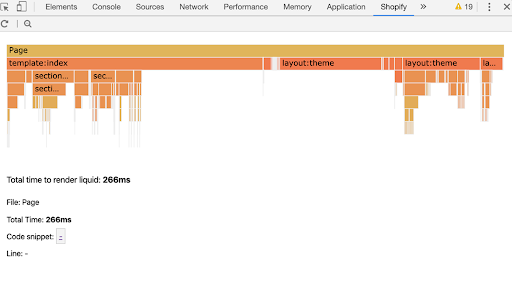
A final tool that we’ve been a fan of (and are hopeful Shopify won't discontinue, because it has definitely gone under the radar), is the Shopify Liquid Inspector.
This Chrome Extension / Dev console tool is developer-focused and requires access to the theme of the site. It generates a detailed flame chart illustrating how all the Liquid code is loading throughout the page load, akin to the classic waterfall diagram for 3rd party JavaScript. However, in this case, the focus is entirely concentrated on the theme Liquid code.
The benefit of this is being able to dig into each set of liquid tags and explore what is happening per page or template. This then highlights the features through the page that contribute most heavily to load times, or if certain elements have inefficient Liquid. A common example might be looping through product IDs to check for a matching product, and within that, looping through the whole list of Tags to see if that product has a matching Tag.
It serves as an excellent method to validate significant inefficiencies in the code that could lead to spikes in page load times. Additionally, it helps in making informed decisions about the value of a particular piece of functionality, weighing its impact on users.
Key contributing factors
Choice of theme
While not applicable to every brand, the choice of theme is a consideration worth starting with. Despite the considerable enhancements from a technical perspective of many ‘off-the-shelf’ themes available on the theme store, they are generally designed to cater to a broad audience rather than to address specific needs. For example, they often tend to be shipped with three different styles, and a range of functionality that can be toggled on or off.
Consideration should be given to comparing theme performance scores and choosing the appropriate theme from the outset. If this is a focus, it's advisable to undertake preliminary efforts to remove any excess bloat and unused code from the purchased theme, which could make a big impact on performance.
App review / excessive apps
Probably the first suggestion that any developer or agency would recommend typically revolves around conducting a comprehensive review of installed apps. This involves assessing their utility and determining whether they contribute value, or have become redundant.
Apps can without a doubt have the most substantial impact on site speed, especially when taking into account that there can commonly be 40+ installed on a store. Here are a couple of relevant points here:
- Apps that are installed within the Shopify Admin can often still be loaded in the theme with the rest of the 3rd party JavaScript, regardless of if it is actually being utilised on the frontend.
- Depending on the construction or compilation of the theme, it's not uncommon for apps to linger in the theme even after being uninstalled in the Shopify Admin.
Prioritise a thorough app review, and try to be as brutal as possible around what is being removed. The goal is to ensure there is no lingering trace of these apps within the theme loaded on the frontend.
Be smart about when you’re loading full functionality
Here is another shoutout to James from RenderBetter, who mentioned this when we asked for any of his ideas. His point was, with the likes of BFCM and peak periods, there doesn’t have to be a black and white approach to optimising performance.
Some elements across the site are nice to have, and while the ideal is a fast performance at all times, it makes a lot of sense to be extra stringent when you know a peak period is approaching. He suggests, for a temporary uplift:
“Here are my suggestions:
- Turn off unused and unnecessary theme features (such as hero banners or popups)
- Disable heavy animations and other special theme magic, as these hurt speed and is are even worse for accessibility (e.g. image fades, moving content)
- Remove unused A/B testing code - A/B testing code slows down pages and it's often unused during the holidays
- Remove tracking code unless it's absolutely necessary. The more tracking there is, the slower the page. Would you rather track everything visitors are doing or let them make a purchase?"
James Koshigoe - Render Better
Lazy loading
Addressing lazy loading of images across the site is a common and crucial priority, which can have a significant impact on CWVs.
One point to expand upon here though, is to avoid a blanket application of the loading="lazy" tag across all imagery onsite. While this tag simplifies the process compared to historical methods, it is essential not to lazy load the LCP image, or images above the fold. Doing that will have a negative impact on your LCP score and CWVs overall, a common occurrence across Shopify themes.
Unfortunately, with reusable sections, this does take a bit more effort to be able to checkbox if a Section with image is being used at the top of a page etc. Fortunately, Shopify has recently rolled out native handling of this after requests from the ecosystem, alleviating the need for manual effort. Image positioning on the page is now automatically handled to optimise performance.
Async and Defer Javascript
Async and Defer are two semi-recent (in the grand scheme of things) attributes designed to provide instructions to the browser on when or how to load external JavaScript files. Rather than the browser working down from top to bottom through the list of assets to load and only getting to the next one when the previous had finished loading, the following outlines the process:
- Async: Download this JavaScript file while running through the rest of the HTML on the page, and execute as soon as it is ready.
- Defer: Skip past this file and wait for the rest of the HTML to be parsed before downloading this JavaScript file to become available to use.
However, there are some issues associated with these attributes. Overusing them can potentially result in slower page loads, as numerous scripts may be backed up to load at the end. Additionally, depending on the functionality, there might be instances where it's essential for the JavaScript to be active on a page before some HTML or CSS is loaded. It's crucial to note that this is not a substitute for minimising the amount of JavaScript whenever possible, but rather a tool that can be highly effective in optimising efficiency if used correctly.
Use of GTM
With Google Tag Manager now a prerequisite for GA4 setup, it should be less of a friction point for people to utilise Tags firing to execute scripts and snippets of onsite code.
This would involve moving parts of the theme code out of the theme, and into Tags within GTM for execution. It means that code which is non-essential in the initial page load, is delayed and dynamically injected afterwards.This approach reduces the immediate load for users upon entering the site, and is frequently employed for various tracking scripts. Other examples we’ve seen might be around Live Chat or Marketing Pop Ups which are generally delayed in being triggered.
CRO: User tracking and A/B testing
Expanding on an earlier point, the substantial impact of tools added post-launch is often underestimated. Following efforts to optimise site speed, it's common to introduce CRO focused tools, with culprits such as Hotjar, Clarity, Google Optimise.(historically) etc.
We often see these JavaScript files left on a site over the long-term, and often hardly used where a team doesn’t have resources for someone to be operating them fully. These can be hugely detrimental to how users are experiencing the site, so while they’re very useful for collecting relevant data and validating ongoing strategic decisions, it requires the data to be used.
Our recommendation for these tools is typically to refrain from loading them on the site by default. Instead, activate them selectively for specific tests and validations, switching them off once the desired outcome has been proven.
Review font usage
Addressing the use and handling of fonts within a theme is a common topic that can impact site performance. There are various aspects to consider:
- Minimise font variety: Each font contributes to page weight, and having an excessive variety in the style guide can adversely impact performance. Limiting the number of different font families and weights is crucial for optimal results.
- Selective font weights: Avoid loading the full range of font weights into a page. Often, only a few weights, such as Regular, Bold, and perhaps Light, are used across the site. Loading an entire font family by default, which may include 8-10 different weights, can have a more significant impact than anticipated. Ensure only the weights being used are present.
- Webfonts vs hosting font files: If possible, purchasing the font file and self-hosting it on the domain is the ideal solution. If this isn’t possible, you’ll have a different impact to site speed depending on the external party the fonts are being loaded from. Google Fonts is common and the best go-to, whereas I've always found alternatives such as Typekit to be significantly slower.
- Optimise loading with ‘font-display: swap;’: Incorporate 'font-display: swap;' within the CSS file to instruct the browser to load default font styles until the specified font has finished loading, at which point it swaps them out. This small development change aligns with Google's preferences and offers a better alternative than blocking the page from loading, which can lead to font shifts (more here).
Image assets
This is generally the P1 topic in a page speed discussion and often the most highly impacting area which isn’t tied into the theme development. Images tend to be the majority of the page weight (although depending on the context of the brand it’s not uncommon for this to be the JavaScript) and significant improvements are easily achievable by implementing the right internal processes:
- Ensure correct pixel dimensions: Always make sure that images uploaded to Shopify align with the correct pixel dimensions. Developers can guide this based on the specific element on the page. Precise cropping before uploading prevents unnecessary loading of larger file sizes and avoids potential image blurring during browser resizing.
- Automatic conversion to Webp format: Shopify now automatically converts uploaded images to the WebP format, a better format for browser rendering compared to JPG or PNG. However, older browsers may still receive the original formats. Images not hosted by Shopify CDN, like those from metafields apps, will also render in their original format. Continue using JPG over PNG unless transparency is necessary. Products shot on a grey background (for example), should be uploaded as JPGs with the grey background, and not rendered onto a coloured element.
- Optimisation tool before upload: Run all imagery through optimisation tools such as TinyPNG or ImageOptim before uploading. Avoid uploading raw photography files, as they can substantially inflate individual file sizes. CrushPics is a good easy start for image optimising, however it can’t access all theme imagery, so a preference is to have a solid process internally.
Video assets
Similar to the above, strategically managing video content across the site is equally crucial. While achieving improvements may not be as straightforward as with images, initiating the process by ensuring the video asset is as compact as possible (from whoever created it), is the first step.
Hosting the video file vs using an embed from YouTube or Vimeo is often a topic of conversation, and there are obviously benefits in using those services and embedding. They are user friendly, more discoverable if publicly available, and pretty configurable within settings. However with Shopify’s recent updates this year around handling video, a preferred route is to upload into Shopify and load on the domain via Shopify's CDN where possible. Also where possible, avoiding autoplay functionality and loading the video behind the click of a thumbnail placeholder image is much preferred.
Excessive HTTP Requests
Each time your site loads an asset (an image, tracking pixel, another JavaScript/CSS file), it triggers an HTTP request. In simplest terms, the more requests your page makes, the slower it becomes. The aim is to minimise the amount of requests as much as possible.
Reducing the number of requests can be achieved by techniques like combining CSS and JavaScript files. However, this becomes more challenging as you integrate more third-party vendors. Shopify 2.0 can now allow Apps and JavaScript to be loaded only on the pages or within the Sections where it is used, rather than always across the entire site, which can be very impactful.
In the past, due to limited functionality, it was common to use apps for managing metafields.
Often each call for a piece of data or image from these metafield managers would be an additional external HTTP request, and can quickly add up to a high amount. Shopify's changes over the course of this year to enhance metafields functionality emphasise the significant benefit of managing all this data natively whenever possible.
Poorly written theme code
Achieving optimal code quality is undoubtedly easier said than done, and it encompasses considerations from the above-discussed points. Among various factors, poorly written code, either in its entirety or specific bits of functionality, can significantly impact page load times. The fundamental principle is simple: the less code needed to accomplish the end goal, the better.
One common recommendation, observed in almost every Lighthouse analysis, is to reduce (and minify) the amount of CSS and JavaScript. Overusing JavaScript, relying excessively on external libraries for quick problem-solving, or employing inefficient CSS with unnecessary repetition can substantially inflate the volume of code in the final theme output. The challenge arises because, at this point, it becomes more challenging to go back and optimise. Hence, this area needs to be actively owned by developers, and should be at the forefront of their minds when making technical decisions.
In some instances, poorly written code might be confined to a specific, more complex functionality. Utilising tools like the Shopify Liquid Inspector can be instrumental in identifying such instances where a mistake or a block of inefficient code is causing issues. It may need understanding and patience to fix. For example, looping through a set of data or using an API endpoint could work perfectly in development, but in production with the real product data, performance can vary significantly. This underscores the need for a robust development environment in Shopify, a facet that is currently lacking, but hopefully improves soon.
What next?
After reviewing all of the above and getting the theme and configuration into a good place, there are some further points worth having in mind to push your Shopify theme build further:
Ongoing Hygiene
This won’t improve any further, but is critical to ensuring the site does not degrade over time, and continues to perform at the levels you get it to. The right balance to this is having monitoring that runs and alerts daily. However, to add depth, it's essential to incorporate more thorough reporting and checks into a monthly hygiene process. This should include:
- Review of Google Search Console and ensure there has been no negative change in any of the pages being indexed.
- A shareable monthly report with the top-level metrics you’re monitoring, and any trends in change across the month.
- Using tools above to check that file sizes and page weights have not spiked, or images and videos imported without being optimised etc.
Consistent checks are essential because the factors mentioned above can be influenced by various elements: changes rolled out by Google, updates implemented by your developers, global updates from Shopify to the server setup or CDN, or alterations made by content teams uploading and editing content throughout the month.
Third party optimisation platforms
Because the server setup is pretty much locked down, to optimise any further at this point on a native Shopify implementation does require utilising third party technology. The proven options here are very specialised, making them particularly suitable for established brands with substantial traffic volumes. The investment in these platforms is offset by increased conversion rates at the percentage of page load improvement.
Render Better is an option that we have seen good improvement to CWV metrics with several Shopify clients, and particularly a noticeable improvement to when the ‘first paint’ hits. The tool provides a side-by-side analysis of a site loading with or without its integration, showcasing a notable speed boost in the initial paint of the title and main image. Operating through the addition of a subdomain, it smartly loads external assets and caches imagery via a single domain. This feature has proven especially crucial for premium fashion brands, showcasing its effectiveness in optimising the user experience.
Yottaa is another example of a tool which can be reviewed, and we’ve again worked with several clients to get an improved total page load time. They offer a really quick setup via a snippet, which in a short trial period can start to compare your pages with some using their optimisations and some not in order to get an idea of impact. Specifically designed to sequence and load third-party scripts efficiently, Yottaa considers their servers and response times. This tool proves most impactful for sites with larger tech stacks and greater reliance on 3rd party vendors.
Third party asset optimisation platforms
While we’re generally a big fan of Shopify’s CDN, and it continues to be improved to deliver better response speeds globally to all merchants using Shopify, it is a one size fits all setup. This implies a balance in the level of optimisation applied to images and videos delivered by the CDN, suitable for the 98% of merchants that use it.
However, for the remaining 2% of merchants operating on a larger scale, there are avenues to extract more value from the CDN, particularly concerning images and videos. In various client scenarios, we've explored alternatives such as Cloudinary and SpeedSize for advanced asset optimisation. Both of these are essentially substituted for Shopify CDN within the theme. It's worth considering the trade-off, as the ideal scenario would involve minimising external calls for these assets. Over time, Shopify may further enhance its capabilities to match the optimisations offered by these. However, we have definitely seen positive and impressive results from these in specific use cases right now.
Final thoughts
As Shopify continues to innovate and execute, we see a lot of the technical fundamentals which have been problem areas over the years be much less of a barrier. However, site speed continues to be a massive point of discussion, and a topic that consistently arises when we speak to merchants about their build. Hopefully this article outlines how to best monitor and approach a strategy to tackle site speed issues, and actionable reference points into a lot of the common problem areas.
If you have any questions about your own performance around a Shopify Liquid build, feel free to drop me an email or reach me on LinkedIn. I’d also love to see any really well executed theme examples, or any further common issues that I've not covered!
Subscribe to our newsletter
Our monthly newsletter is designed to be the most actionable and inspiring eCommerce newsletter in existence, combining examples of eCommerce innovation, benchmarking insights from the industry, and the latest news and eCommerce trends.
By signing up you are agreeing to our privacy policy.