
How to Measure the Incrementality of Brand Awareness on Paid Media Activity
Incrementality is defined as the measure of the true, additional value created by paid media activity, i.e. what occurs solely because of your efforts and would not have happened otherwise. It is a concept that lies at the heart of understanding impact, yet remains elusive for many.
As a result, brand awareness activity is more important than ever. Today, 63% of globally surveyed customers are purpose-driven, choosing to purchase from brands which align with their values. This shift creates the necessity for brands to move away from solely bottom-of-funnel, conversion-focused paid media strategies and invest in storytelling marketing.
In addition to this, reach saturation is a key factor in running brand awareness campaigns, ensuring audience pools are seeded and reducing fatigue in existing audiences.
So what is the challenge in measuring brand awareness activity and how can we accurately measure incrementality?
What is the challenge of measuring brand awareness?
Conveying the value of brand awareness activity across paid channels remains challenging and is less tangible than conversion-led activity. As brand awareness relies on softer metrics (clicks, engagements, CTR, engagement rate, video views) rather than revenue or ROAS, ‘success’ is less clear.
Traditional methods, such as lift tests for metrics like ‘Ad Recall’ or ‘Search Lift’, offer isolated glimpses (such as, ‘there was a 1.5x lift in searches’). These fragments, while informative, rarely illuminate the broader, interconnected effects of brand awareness across channels, its influence on critical brand outcomes or the true incrementality.
What constitutes brand awareness activity in paid media activities?
Brand awareness creates initial touch points with prospective customers through branded content. Simply put, we are reaching users who have never interacted with your brand before, using content that introduces the brand in a considered way, communicating your mission, ethos, unique selling points, and more. The term ‘brand awareness’ is a term used frequently by advertisers, however it can constitute several things.
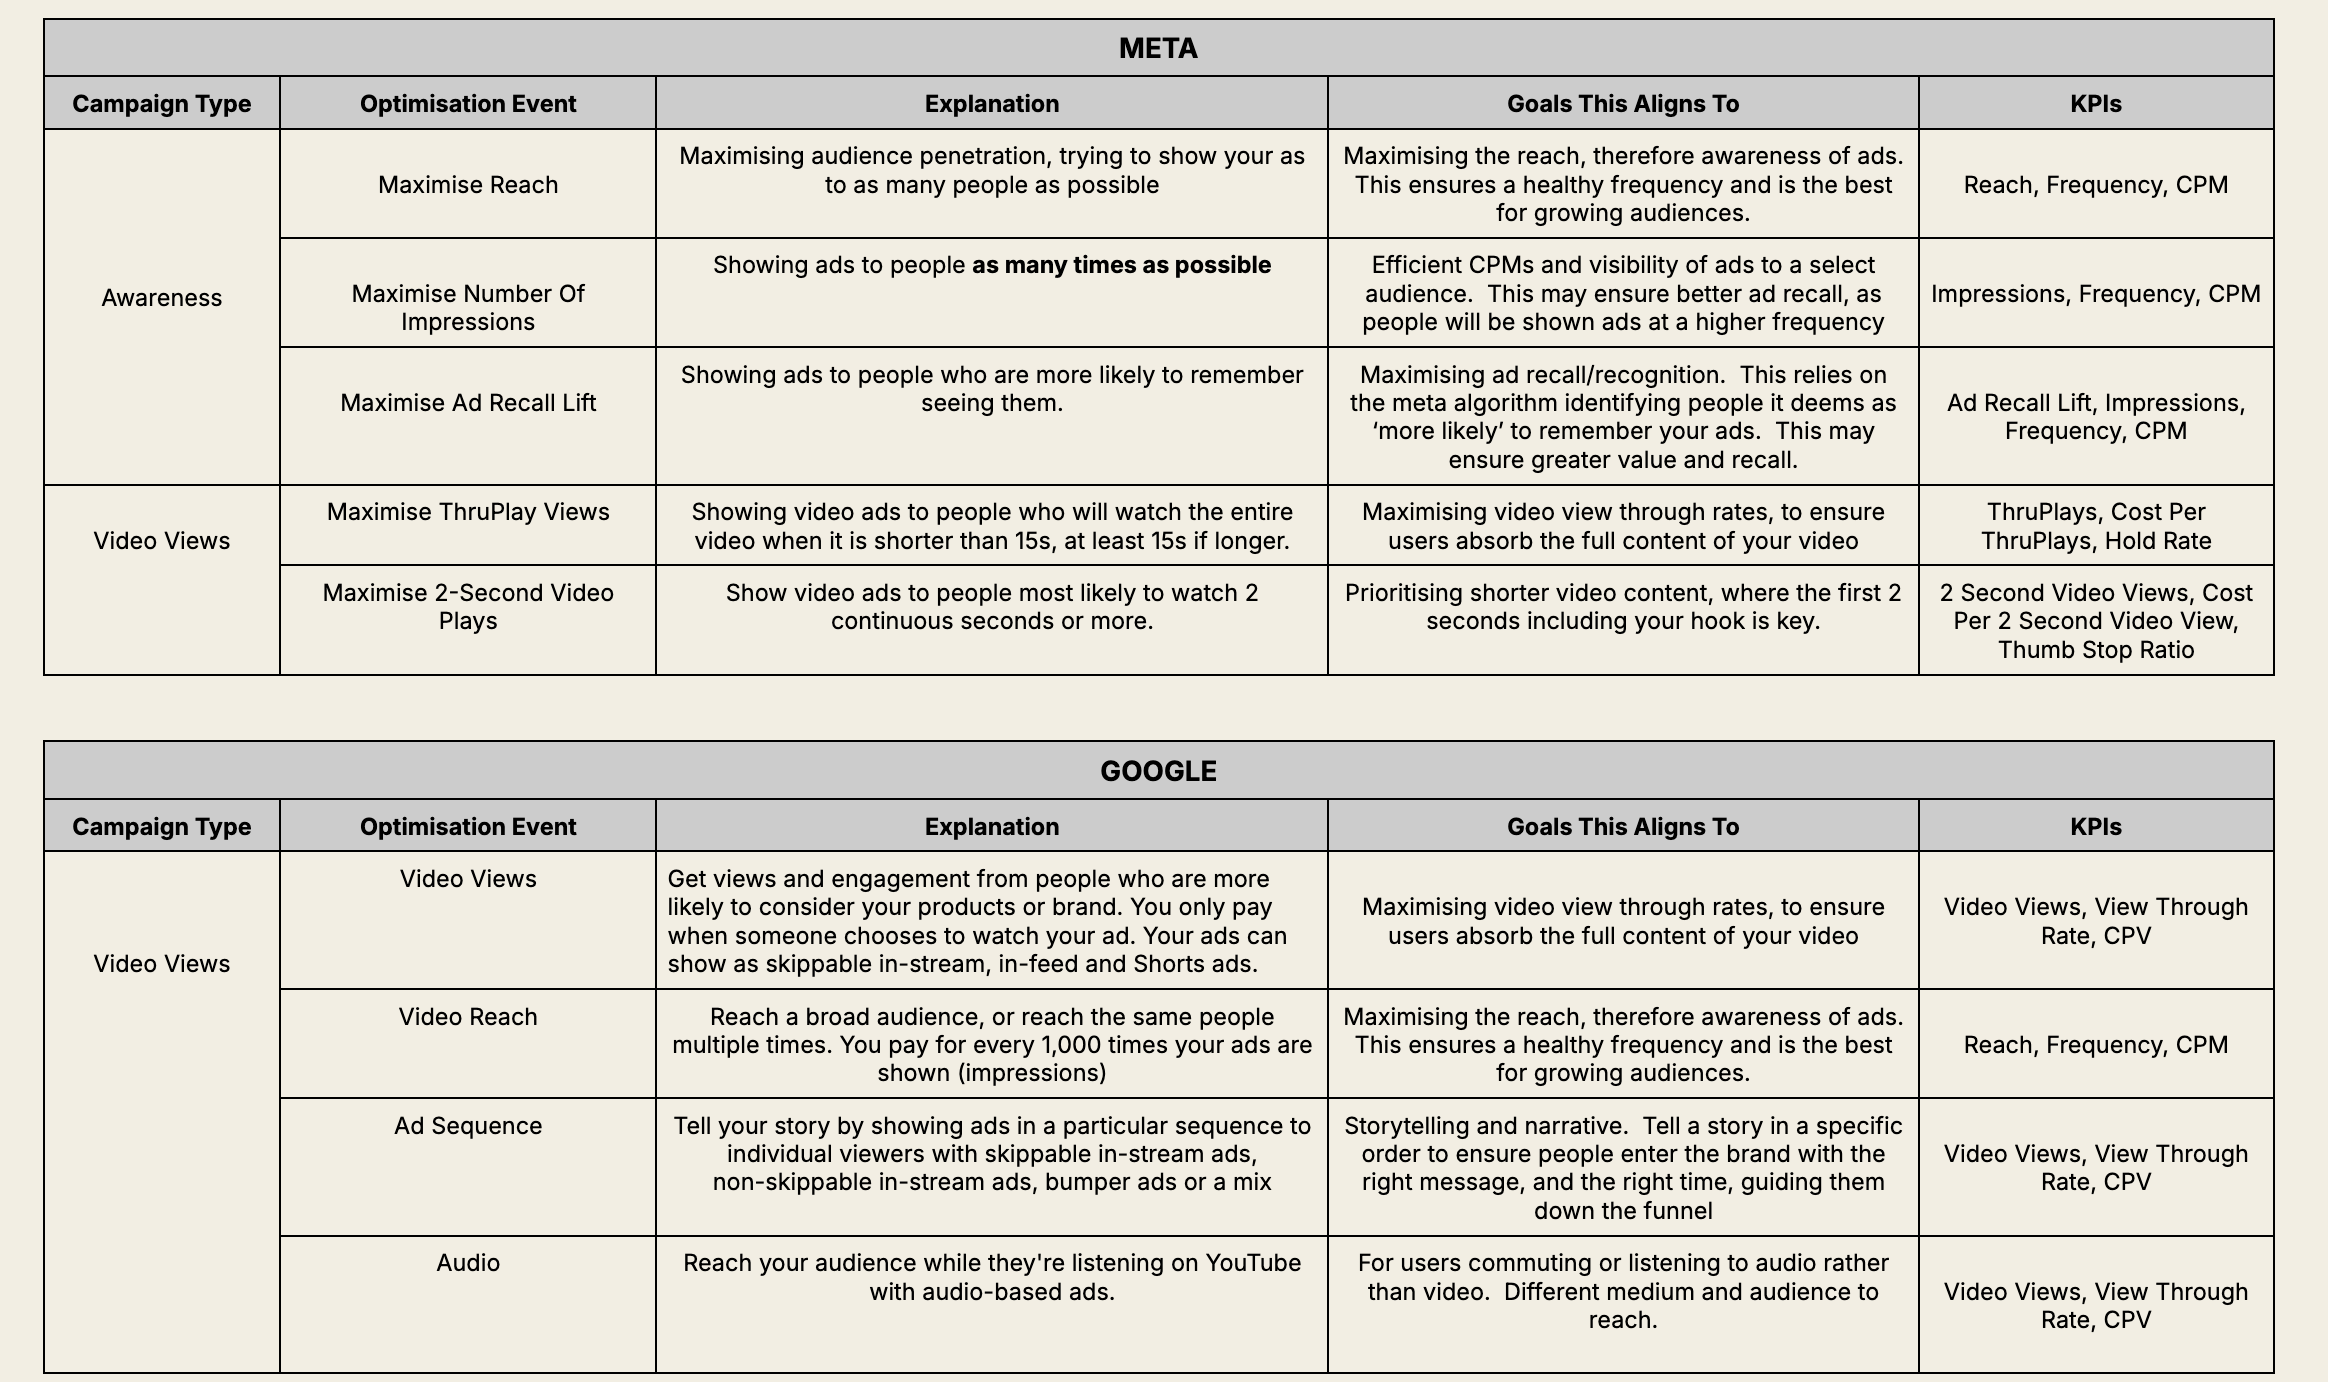
On Meta, when selecting the ‘Awareness’ campaign objective, there are multiple events you can optimise towards, including Reach, Ad Recall, Video Views or even Store Location Awareness.
Similarly, on Google, when selecting the ‘Awareness and Consideration’ campaign objective, you have a choice of three campaign types, Demand Gen, Display and Video - each of which can be optimised to a different event.
Below is a summary matrix for each platform and activity type to help align with your goals and objectives.
How can you measure the impact of brand awareness activity?
1) Brand Search Demand
A clear trend that has been identified is the link between brand awareness activity and brand search demand. Spending on brand awareness positively influences brand search demand by reaching more customers with story-led content and driving them to search for a brand’s key terms on search engines. So, how can we demonstrate this?
You can plot historical brand searches on a line graph alongside brand awareness spend. Brand search demand can be obtained by two methods:
- Google Keyword Planner - This tracks the average monthly brand searches on Google. This is a simplified approach, and can lead to more granular trends within a month being missed.
- Pure Brand Campaigns - If you bid on your pure brand keywords, you can download impressions over a time period to reflect brand search demand. For added accuracy, pull impressions alongside search impression share to calculate the full volume of impressions, even those you did not win the auction on. Take your impressions and divide it by your search impression share to obtain 100% of your brand impressions, i.e. total brand search demand.
2) Wider Channel Impact and GA4
Brand awareness creates more informed customers. By reaching customers with the right message at the right time, those continuing along the purchase journey will be of higher intent, removing barriers to purchase due to better brand education.
To understand the impact of this, we need to evaluate pre and post-brand awareness periods to identify the incremental impact. Google Analytics 4 (GA4) is our go-to-tool for channel performance and last click attributed data.
- Navigate to Life Cycle > Acquisition > Traffic Acquisition.
Filter the rows to ‘Session Primary Channel Group’ or your chosen channel groupings.
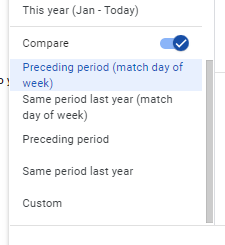
- Use the comparative date range function, filtering the date range to the period where you ran brand awareness activity, and click ‘compare’.
This will compare the same time period prior to your brand awareness activity, allowing you to see the % and nominal change in key metrics, segmented by channel. Here, you can see which channels saw a change pre- and during your brand awareness activity, and the impact to wider channels beyond paid search or social.
The key metrics to look for in this process would include:
Sessions - Did more users land on site and undertake a session?
Bounce Rate - Was the quality of traffic still high, or did brand awareness activity lead to more users bouncing?
Conversion Rate - Did this improve or decrease with the advent of brand awareness activity?
To summarise, using GA4 to evaluate wider channel impact is a great way to convey the value of brand awareness, beyond platform metrics. Demonstrating the positive impact of brand awareness on other channels helps justify marketing spend in this area, making it a crucial part of your typical strategy.
3) Seeding Remarketing Audiences
Another benefit of brand awareness, though often overlooked, is using these strategies to seed your remarketing audiences. Whether a user engages with an ad, clicks to site, views content or even adds to cart, this is all information that is gathered by the Meta platform (if off-site actions) or the pixel (on-site). These actions can be used to group users into audience segments, and so, if brand awareness reaches more users who carry out these actions, it leads to the secondary benefit of growing our remarketing pools.
Tracking the impact of this was previously much easier. However, privacy changes have since led to the audience size estimation in campaigns becoming obsolete and unworkable, meaning audience sizes are logged as 0. A way around this is to frequently monitor the size of custom audiences in the ‘Audiences’ section of Meta. Logging this weekly, you can track the growth in custom audiences for key events such as Engagers, Website Visits, View Content, Adds To Cart and Initiate Checkout. Pick a suitable date range such as the last 30 days, and monitor whether this grows after spending on brand awareness.
4) Custom Conversions in Meta
Meta is notoriously under-attributed by last click attribution, making it challenging to prove its value in Google Analytics. This under-representation often leads to Meta’s true contribution to revenue and traffic being underestimated.
Meta reaches prospective customers and creates that first touchpoint. However, users often leave the platform and search for a brand on search engines instead. While Meta is responsible for reaching that customer, it doesn’t get credited with the resulting traffic or the eventual revenue generated. Custom Conversions in Meta can help to highlight the impact that Meta has on other channels.
UTMs or ‘Urchin Tracking Module’ is the enabler in this situation. Most advertisers and retailers will have used UTMs as a method of tracking, added to the end of a URL to track performance of campaigns and specific channels. We can leverage these UTMs in Meta, setting up custom conversions to fire only when certain elements of a UTM are present.
Below shows the set up of an example custom conversion. As we can see, the rules state that the event will only fire when URL traffic contains UTMs attributing it to Google for brand searches. Therefore, the event will fire when Meta drives traffic to the site, but has been attributed to Google when someone searches for branded terms.
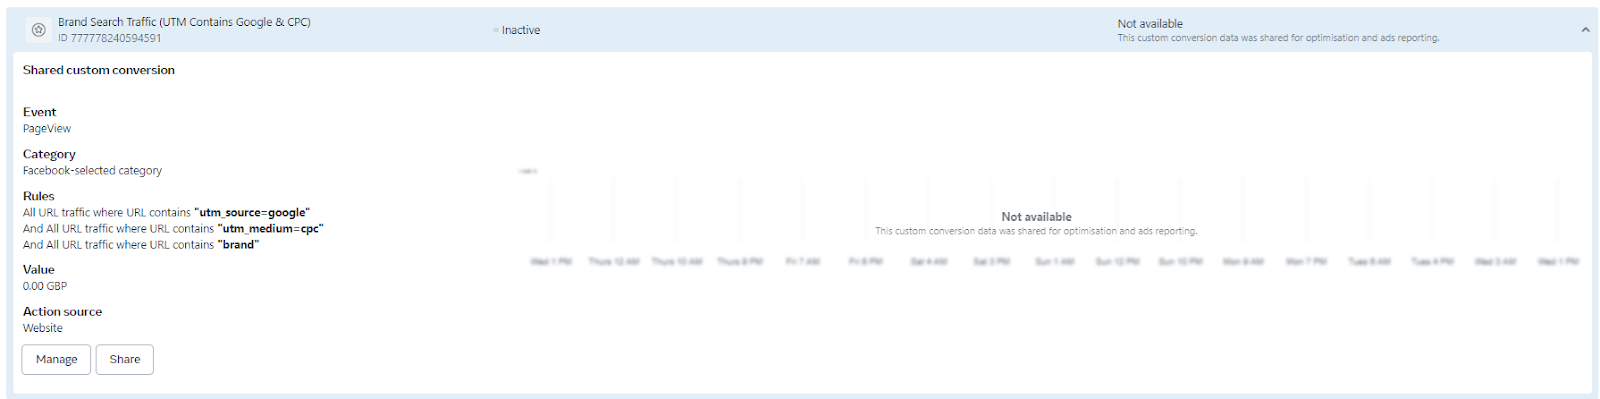
This essentially demonstrates that Meta is responsible for website traffic that has been attributed to Google, thereby uncovering hidden value in Meta. We can take this a step further by estimating the proportion of purchases and revenue that Meta drives through branded terms on Google.
For a given time period:
Take the average conversion rate from click to purchase, and multiply this with the volume of events fired with your custom conversion. This will give you the volume of purchases.
To work out the revenue, simply multiply this by the average order value (AOV) in Google over the same period.
Lastly, to contextualise this fully, calculate the return on ad spend (ROAS) of this activity, by dividing the revenue we just calculated, with your brand awareness spend.
However, it’s worth noting that the custom conversion operates on a 1-day view, so a significant proportion of these actions will not be recorded due to the attribution window. While this is a limitation, it remains a strong indicator of the change in traffic attributed to meta, and the relationship with brand awareness investment.
5) Media Mix Modelling
Media Mix Modelling or ‘MMM’ is a great way to convey the value of brand awareness, as a part of the marketing mix. MMM is a form of statistical analysis using multi-linear regression to determine the relationship between a dependent variable (in our case, topline business revenue) and the independent variable (ad spend across channels, and campaign types). There are several different tools one can use to achieve this, including Google’s version, called ‘Google Meridian’.
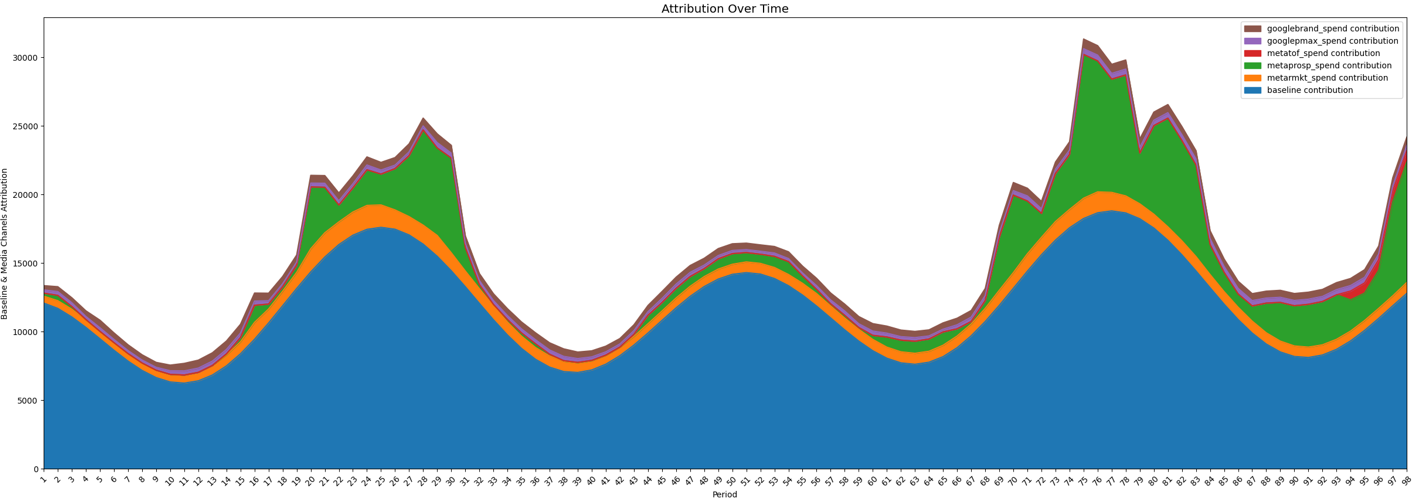
So how can advertisers leverage MMM to prove the value of brand awareness? By segmenting ad spend by key activity types such as conversion, brand awareness or lead generation for example, we can input them as the independent variables, and evaluate their contribution to topline business revenue (the dependent variable).
Below is an example output graph from Google Meridian. The contribution of each independent variable is conveyed by the area highlighted in the graph. The larger the area, the greater the contribution. A great way to evaluate the impact of this is seeing whether the contribution area grows over time, with incremental increases in brand awareness spend for example.
6) QR Codes and Connected TV
YouTube and connected TV is a great way to connect with prospective customers through curated, branded content. However, a significant limitation of connected TV is that users are often unable, or unlikely, to take immediate action on the platform, leading them to search for the brand on their phones or laptops instead. While this will still ultimately lead to an uplift in brand searches, it adds an additional step which could cause a drop-off in users completing the first stage of the journey to purchase.
The immediacy and ease of use of QR codes make them a strong solution. Adding a QR code at the end of, or in tandem with, your videos on YouTube allows users to visit your site while continuing to watch the video and absorb the content. An added benefit is that we can configure the QR code with UTMs, meaning we can track how much traffic YouTube is actually responsible for.
This method adds an extra layer of context and data to YouTube brand awareness campaigns, moving beyond in-platform metrics that can be underattributed (such as clicks), and conveying the value of this activity across other aspects of Google.
Final thoughts
Evaluating the success of brand awareness activity is multi-faceted, and should be looked at through multiple lenses. There is no ‘catch all’ or ‘one size fits all’ approach that will provide the definitive answer. We must take a step back and widen our gaze to ensure the full impact is identified and evaluated. Adopting a holistic approach aims to move away from the simplistic and reductive lift studies to analyse brand awareness activity, favouring methods that provide actionable insights and how we can adjust strategy moving forward.
Here are key principles for effective evaluation:
Measure across multiple metrics: Leverage tools like GA4, brand search demand, and custom conversions to capture a comprehensive view of brand awareness.
Balance short and long-term data: Analyse immediate performance indicators (e.g., clicks, engagement) alongside long-term growth signals, such as increases in brand search demand and remarketing pools.
Focus on incrementality: Identify and isolate the true impact of brand awareness activity, distinguishing it from correlation with other efforts.
A/B test consistently: Test varying formats, platforms, and campaign objectives to uncover what resonates most and drives measurable results.
Evaluate cross-channel influence: Assess how brand awareness efforts impact other channels, including organic search performance and remarketing success.
Promote transparent reporting: Clearly communicate the limitations, assumptions, and potential biases in the data to ensure trust and clarity with stakeholders.
All methods are not without caveats. Honesty and transparency should be at the forefront of analyses, to foster a relationship of trust between advertisers and retailers and ensure the right decisions are made off the back of such methods.
Subscribe to our newsletter
Our monthly newsletter is designed to be the most actionable and inspiring eCommerce newsletter in existence, combining examples of eCommerce innovation, benchmarking insights from the industry, and the latest news and eCommerce trends.
By signing up you are agreeing to our privacy policy.