Published: Aug 2023
Type: Paid Media
Category: Paid Shopping, Paid Search

A Guide To Classify Products For An Effective Performance Max Strategy
Performance Max has been instrumental for scalability since its roll out in November 2021 (since the sunsetting of Smart Shopping), acting as a reliable vehicle for budget increases without compromising on ROAS.
Performance Max is Google’s latest iteration within Google Shopping, accessing the entirety of the Google Ads inventory in a single campaign (YouTube, Display, Search, Discover, Gmail and Maps). Leveraging machine learning is the key difference and with this, advertisers are able to find more converting customers by customising the goals that matter to the business (e.g. new customer acquisition), therefore driving more value and acquiring rich insights, with limited inputs for set up.
Advertisers will often opt for the ‘catch all’ approach initially (aligning with best practice, recommended by Google), running a singular Performance Max campaign that includes all products, to allow the algorithm freedom to gather learnings without restrictions. While this certainly garners strong performance at the topline, further investigation reveals poorly deployed spend across a worryingly high number of products drives little to no return. While this is a common and a recommended starting point to get things off the ground, in time the system will favour certain products (seeing varied success), and neglect others.
This blog explores an approach to enhance one’s Performance Max strategy, involving classifying products based on historical performance and tailoring the bid and budget accordingly.
Why classify products?
Should all products be allocated the same budget and Target ROAS bid strategy? Let us explore the following hypothetical scenario:
Here we have three products, all performing differently. Over the last 30 days, Product A has spent £100 achieving £1,000 in revenue at a ROAS of 10, Product B has spent £1, achieving £0 in revenue at a ROAS of 0 and Product C has spent £150, achieving £75 in revenue at a 0.5 ROAS.
Based on this performance, logically we would identify:
- Product A is a strong performer, and should be free to spend more if it can maintain this performance
- Product B isn’t serving, so we’re unable to identify whether it’s a product worth investing in
- Product C is a poor performing product and an inefficient use of budget.
For the above examples, we can see some very different performances, with different actions we’d take for each in order to see optimal performance. With one campaign, each of the above products are being fed from the same budget, and asked to optimise towards the same targets.
How to approach classifying products
To increase the scale of this, plotting product performance on a scatter chart gives a very quick snapshot into the distribution of products based on spend and revenue. As seen in the example below:
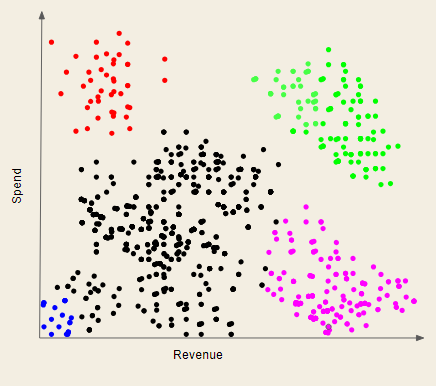
Groupings of products begin to emerge once the data is visualised, which we can begin to define:
- Best Sellers (Green): Products that are high spending and high return
- High Efficiency, Low Scale (Pink): Products that are achieving strong returns, but at a lower spend.
- Poor Performers (Red): Products responsible for a significant level of spend, but with minimal return on investment and therefore detrimental to topline performance.
- Under-Prioritised (Blue): Products that have not had much budget allocation and not given a chance to perform.
Based on this simple exercise, we can see that there are instances where Performance Max isn’t utilising products optimally. One way in which we can guide the Performance Max algorithm is by isolating the product groupings that we have identified, implementing a new campaign structure, using different ROAS targets and budgets accordingly. This allows top performing products to be given access to additional budget and stretch their legs, wastage on poor performers to be reduced, and spend to be allocated to learning more about those products that haven’t seen budget previously.
A key step in implementing this involves using external datasheets (Google Sheets), pulling in historical performance from Google Ads to classify products into discrete categories. Using formulas in Google sheets, thresholds can be established in order to create a system of classification.
Once classified, we can import this datasheet as a supplemental feed to Google Merchants Centre (GMC) setting the product classification column to a custom label, and filtering for this in the listing groups in Performance Max.
Top Performers
Top performing products, responsible for a significant % of overall revenue, at an above average ROAS. These products represent the safest areas to invest in and should be a priority while efficiency holds.
E.g. A product that ranks in the top 20% as a revenue driver, at a >2.5 ROAS
Middle Performers
A product ranking achieving a strong ROAS, but at a lower overall % of revenue.
E.g. A product that does not rank in the top 20% as a revenue driver, but achieves a >1.5 ROAS
Poor Performers
Products responsible for a significant proportion of spend, with very low ROAS <1.5, and therefore detrimental to topline performance.
E.g. A product that ranks in the top 50% of spenders, at a < 1.5 ROAS
Under-Prioritised Products
Products historically deprived of budget, therefore having achieved a very low volume of impressions and clicks. This mainly represents an area of lost opportunity if not explored.
E.g. A product ranking in the bottom 10% of spenders and impressions
How to structure your campaigns?
Once the hard work of classifying the products into categories is done, this can then be applied in a new campaign structure, bidding on each product category differently to ensure the maximum return, at the strongest ROAS.
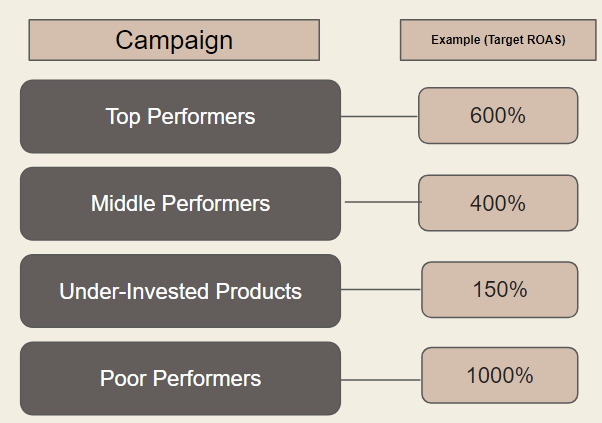
The ‘Target ROAS’ for Poor Performers is set incredibly high (1,000%), so as not to exclude products entirely, but reduce the amount of investment directed towards them. Under-Prioritised Products are given a low ROAS target (150%) to encourage spend, while Middle and Top performers are set a middle to ambitious target of 400% and 600% respectively to push performance, but not limit spend.
Below summarises the campaign structure:
Key benefits of this structure
Dynamic optimisation
This method leverages a dynamic data sheet, refreshing data and importing to Google Merchants Centre daily to ensure the structure is fluid, allowing for sudden peaks and troughs to be accounted for and products to be housed in the correct campaign.
Taking back control
Performance Max is a black box, with limited levers to pull to influence performance. This method provides an advertiser additional control over which products are prioritised, and the bid strategy to which they are associated. This method ensures algorithms aren’t allowed to coast on a small number of top performing products, while allowing wasted spend elsewhere.
Scalability and efficiency
‘Under-Prioritised’ products, which are now separated into their own campaign have the opportunity to spend for the first time, therefore unlocking a segment of the catalogue that was previously underutilised. This presents an opportunity for advertisers to uncover hidden gems, while filtering out poorer performers into lower spending campaigns.
Key considerations of this structure
Exploration vs exploitation
There is a fine balance to achieve between exploration and exploitation. Exploration is the pursuit of discovering new opportunities, while exploitation is the utilisation of what is known to work. Over-investment into exploration would result in inefficient performance, while over-reliance on a limited range of top performers can lead to missed opportunities and lack of growth.
The balance of exploration and exploitation cannot be optimised without clearly classifying products and partnering them with the correct bid strategy, and so is unachievable in a single Performance Max Campaign. By implementing a campaign structure such as the above, we clearly define areas for discovery and core products providing stability and assured performance, thereby striking a healthy balance between exploration and exploitation.
The lookback window
The time period in which data is evaluated is important and has two key facets:
The first is sample size. One sale does not define a product as a top performer and worth investing heavily in. With a longer lookback window, we have a larger sample size in which we are able to define clearer thresholds for products to pass in order to be reclassified based on strong or weaker performance. A shorter lookback window would mean finer margins in performance between products, making it more difficult to have robust thresholds a product must cross to be redefined.
The second facet is the ‘seesawing’ effect. A lookback that is too short may lead to products ‘seesawing’ between groupings, whereby a product moves from the under-prioritised category to a top performer once generating a conversion at a strong ROAS. The longer the lookback window, the longer a product spends in a given category, providing consistency and allowing the bidding algorithm to be deployed with confidence.
Poor performers
Poor performers will not be classified as such forever. Such products will be split out into their own campaign with a high ROAS target of 1,000% in order to capture high value users, only at a strong ROAS (maintaining visibility of these products). Therefore, these products may eventually meet the threshold to be reclassified as a middle or top performing product (due to seasonality or other factors), meaning no opportunities are missed.
This should always be monitored closely, to ensure poor performing products do not cause issues further down the line, and may require products to be removed from the feed entirely if the bidding algorithm proves a product cannot be trusted to deploy budget efficiently.
Key takeaways
Performance Max can be powerful for any ad campaign, but has to be monitored carefully, guided effectively and evaluated constantly. Our key takeaways here include:
- Performance Max performance should not be taken at face value, as in depth analysis shows inefficient deployment of budget across products and significant opportunity for optimisations.
- We have the ability to take back control of the ‘black box’ that is Performance Max, by leveraging dynamic product classifications based on real time data from google ads.
- This garners several benefits, including dynamic optimisation of products and bid strategies, taking back control of the black box and enhancing scalability and efficiency. However, there are key facets to consider, including the balance between exploration v exploitation, the length of the lookback window and how to treat poor performers in the product mix.
- Bid strategy and budget across different products is key to achieve the right balance of exploration (finding new top performing products) and pushing existing top performers.
If you would like help enhancing your Performance Max strategy on Google, do not hesitate to contact us.
Subscribe to our newsletter
Our monthly newsletter is designed to be the most actionable and inspiring eCommerce newsletter in existence, combining examples of eCommerce innovation, benchmarking insights from the industry, and the latest news and eCommerce trends.
By signing up you are agreeing to our privacy policy.